How Do I Make Sense of IEP or Private Testing Data?

We are in a data-driven world here in education. But the challenge is that so much of the information is next to impossible to interpret. As educators, it's easy to get wrapped up in state-standardized assessment results. So when you are thrown a child's IEP it can be hard to make sense of all those tests and how they correlate to what you are seeing on state standardized testing...and more importantly, in the classroom.
Typically a comprehensive evaluation (either the IEP Eligibility, Triennial Testing Report, or a Private evaluation) should consist of testing in one or more of the following areas:
Language Testing
Typically language assessments are completed by a speech-language pathologist and will give you information on the student's ability to understand and produce language. They will look at Expressive Language (the student's ability to use age-appropriate vocabulary to express their knowledge and ideas), Receptive Language (the student's ability to understand vocabulary and concepts that are provided verbally, Understanding & Following Directions, and the student's overall command and use of the language from grammatical structure to articulation). These results can help us to understand how much information a child is inputting and outputting in the classroom setting.
Cognitive Testing
Typically cognitive testing is completed by a psychologist (either the school psychologist or a private psychologist). Cognitive testing looks at a student's overall aptitude for success. Often when we look at cognitive testing we are looking at setting a benchmark for performance. Depending on the student's individual profile, a Full-Scale IQ or some other measure of General Abilities will be calculated. This overall score sets a prediction for where we expect a student to fall academically. Typically cognitive assessments will measure Verbal Ability (which should correlate closely with language assessments), Fluid and Spatial Reasoning, Working Memory, and Processing Speed. These scores also help us to understand how information needs to be structured and what type of accommodations may need to be put in place given a student's more "innate ability".
Academic Testing
Academic testing should be providing concrete measures in the areas of Reading, Writing, and Mathematics. Usually, these assessments are given by a Learning Specialist, Educational Diagnostician, or Psychologist.
Social/Emotional Testing
Social and emotional testing should provide concrete information on how a child is handling social situations with peers and emotional regulation on a day-to-day basis. These assessments often rely heavily on parent and teacher reports and are given by a psychologist.
Motor Functioning
These assessments are typically provided by an Occupational or Physical Therapist to determine whether there are any specific motor or sensory limitations that may be impacting a student's ability to perform in the classroom.
So, the question becomes:
How do we interpret IEP scores?
Tests that are provided in an IEP or privately typically use some type of Standard Score measurement. Standard scores rely on the standard bell curve which means we expect that the majority of students are scoring in one particular way and that we have outliers who are either scoring higher or lower than the majority of the students. So for example in the classroom - if you gave a test and the majority of students got a C you would expect that if you chose a student randomly out of your class they would likely have received a C. However, a group of students likely would have received a B, and a few students may have received an A. You would also have a group of students who would have received a D, and a few who received an F.
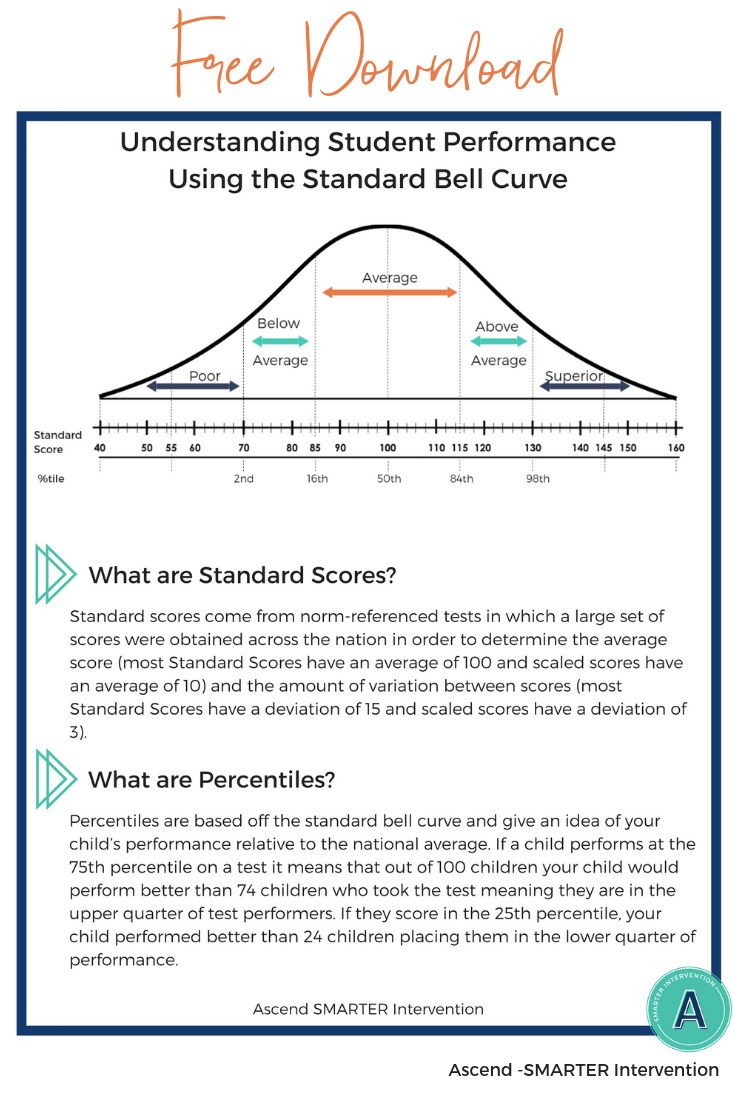
What is a bell curve?
The standard bell curve is a visual of a "normal distribution" of performance. Normal distribution means that students across the nation were given an assessment and the scores were averaged out. The majority of students fall right at the average. However, a percentage of students are scoring higher than average and a percentage of students are scoring lower. The normal curve assumes that the same amount of people scored higher than the average as scored lower than the average at a predictable interval.
What are Standard Scores?
Standard scores assume that the majority of students would score 100. You would have some students falling higher or lower than 100 but on average you expect students to perform at a 100. The vast majority of scores would fall within one standard deviation (15 points) around the average score.
This means that the majority of students (68%) would have scores falling between 85-115 on a Standard Score measure. This means that the remaining students are either falling above (16% of students) those scores or below (16% of students) those scores. If a student is falling in the bottom 16% of their peer group, they will struggle significantly in the classroom and those are the students that should be receiving supports.
Standard scores are the most common unit of measurement using the normal distribution. We use Standard Scores to measure student performance to determine how students are performing in comparison to their peers across the nation. Standard Scores have been statistically calculated such that the average test score is 100. The average "deviation or variation off of the average is 15 points. This means that scores between 85-115 statistically fall within what's considered "average".
What are percentiles?
Percentiles are based on the standard bell curve and give an idea of a child's performance relative to the national average. If a student performs at the 75th percentile on a test, out of 100 students he or she would perform better than 74, putting him or her in the upper quartile of test performers. If he or she scores in the 25th percentile, he or she performed better than 24 out of 100 placing him or her in the lower quartile of performance.
We will be diving into specific tests that are often used or can be used to give you more information on how a student is doing with each of the listed skills next week, so stay tuned!
We also put together a free handout that helps explain the Standard Bell Curve, Standard Scores, and Percentiles!
How do I get a copy?
>>>Download a copy right here!<<<
If you’re interested in learning about how we get our struggling readers into the average range on this standard bell curve we’d love to have you join us for our free online training where we will be talking about the 7 Steps you must follow to get struggling readers to grade level once and for all.