How to Analyze your Literacy Intervention Data

We are back again with the next step in Data Tracking!
This week we are talking all about -
Analyzing your literacy intervention data
Now, we know that the word analyze brings about a heavyweight - but hear us out. Analyzing your data doesn’t have to be hard. We just have a tendency to make it hard.
There are challenges to tracking data in your reading intervention of course:
Figuring out how to track and analyze data quickly!
Knowing what the data is ACTUALLY telling us!
Using data effectively to drive our lesson planning!
And we see the most well-meaning educators making the following three data-analysis mistakes (we know because we’ve been there!) all of the time!
Common data-analysis mistakes
Spending way TOO LONG trying to make sense of our data.
Making the data personal (as though it means something about us and our efficacy as educators instead of just using it as the tool that it is.)
Not using the data we have to drive the activities we are providing to our students and instead, use it only as a way to measure past efficacy.
The bottom line -
Analyzing our data does not need to be complicated (or personal) AND we have to analyze data in order to have the most effective intervention.
Because data drives effective literacy intervention.
If we don’t analyze our data - we may be throwing spaghetti against a wall trying to pick relevant activities for our struggling readers and writers.
Or…
We might be missing them and this opportunity to help change their trajectory altogether.
So, how do we do this without spending a ton of time?
First, we must build data tracking into our lessons. Check out last week’s blog - How to Organize Your Session in a Way That Makes Data Tracking Easy!
Next Step - Analyzing Your Literacy Intervention Data
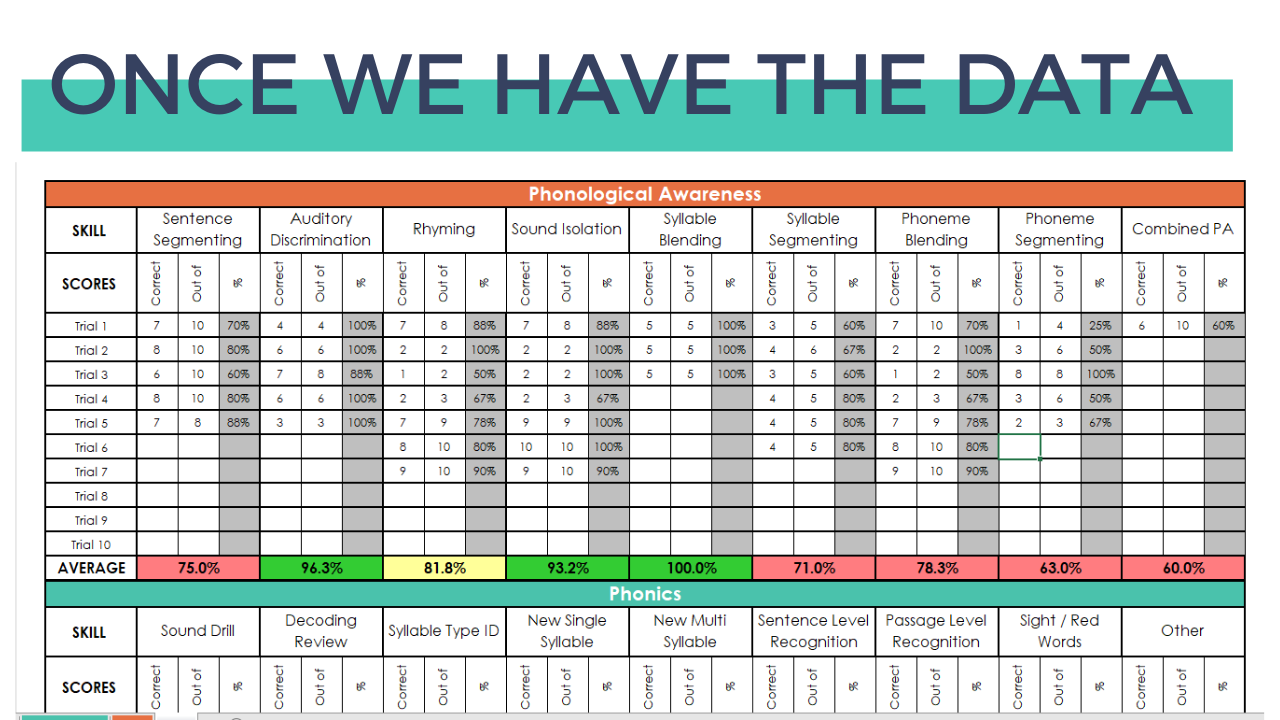
After you track your data, you need a simple system to analyze where your students have continued needs. We use the data tracking spreadsheet shown above, which you can grab >>Here<<!
What you want to be doing, is looking at student trends over time. You want to see if, on average, students are meeting a 90% threshold or better with their activities. This should NOT only occur during prescribed “testing periods.” We should ALWAYS be monitoring our students’ progress with the activities they are completing during their normal lessons. The bottom line is that students don’t always perform the same on “testing days” as they do in their everyday sessions.
So we need to use our intervention data from TYPICAL sessions to know which activities to pull for our students and we should ALWAYS be checking back in on them.
Students’ needs change!!!
So we must always be tracking and analyzing!
Be sure to grab our free Data Tracking System. This tool will help make data tracking easy and help you keep your session data organized.
