How to Track Literacy Data Digitally
Wow, we couldn’t be more glad to bring in a new year! While 2020 was an interesting year, to say the least, we were glad to have learned so many lessons. One of which, was how to stay organized in a completely digital space. We transitioned lessons to a completely digital format. We started seeing our students strictly online instead of in person.
And with all the changes, we realized…
Tracking data digitally was another great way to communicate students’ growth.
By tracking data digitally, we were able to easily capture students’ performance and note what was happening in our sessions. We were also thrilled to realize that tracking data digitally allowed us to share our data with our students’ parents and with our colleagues more easily than ever before. Check out last week’s blog where we talk all about communicating and sharing data here!
Today, we wanted to walk you through…
How we track our literacy data in a digital format
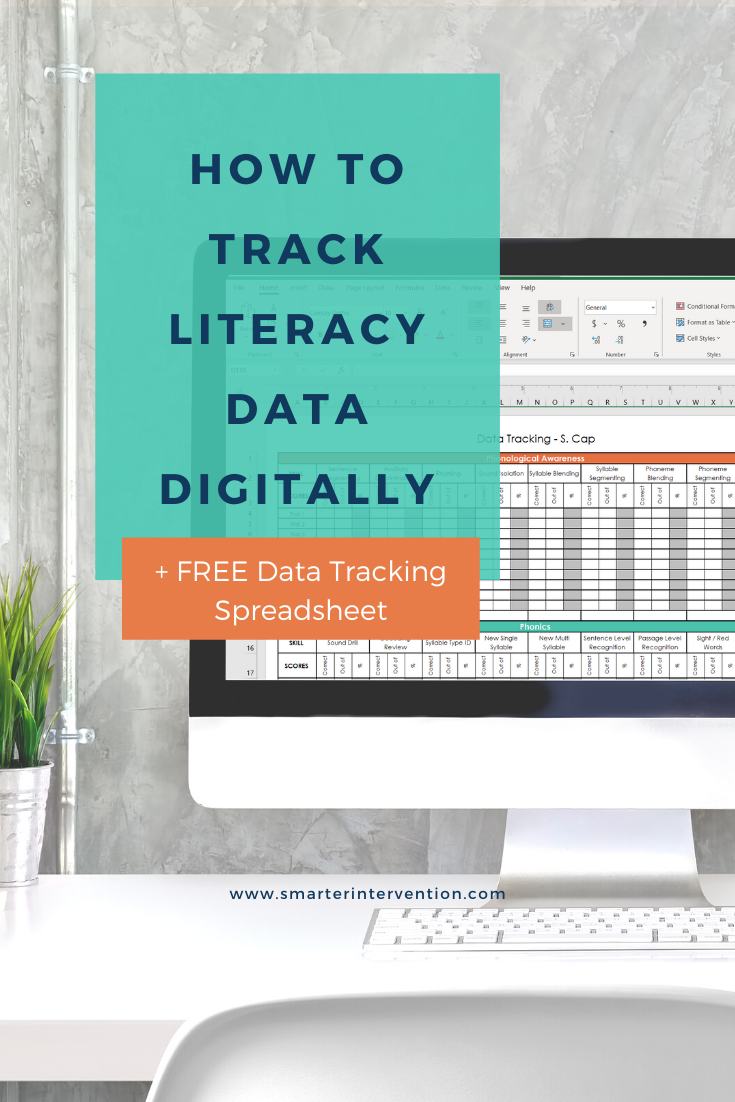
And we wanted to share the EXACT template we use to do this with you!
Let’s jump in - to recap the literacy data tracking process -
First, you want to make sure you are collecting the right data to determine what your students need.
We talked all about the differences between your big-picture data and your granular data here. It’s important to remember that big-picture data helps you put together the most effective groups/curriculum and granular data helps you structure your sessions from week to week.
Next, you want to organize your sessions in a way that makes it easy to collect the data you need to collect.
We talked all about making sure you’re organizing your lessons here. Specifically, you should organize in a way that you’re not flipping back and forth between data sheets AND you want to make sure you’re giving the right number of trials/opportunities to each student to make your life easy!
Then, you need to input your data into a format that makes it easy to analyze.
We talked about how to analyze your data here! Today, we are going to be sharing how you input your data to make your life easy when it comes time to analyze!
Finally, you need to share your data!
We talked all about how important this is and the easiest way to do this here!
Let’s talk more about the easiest way to track your literacy data digitally!
Typically, we start by using good old paper and pencil data tracking sheets.
I actually love using colored pens because I LOVE them AND it helps me keep track of my dates without having to write them in for every student. You can also put this into a page protector and use an ultra-fine tip expo marker (like these) so that you don’t have to use a ton of paper. You can also just enter directly into a spreadsheet if you prefer to do away with the paper altogether.
Then after we have our data, we enter it into our digital spreadsheet.
At this point, you will have a really fantastic reporting tool that helps you see whether your student’s performance is increasing or decreasing over time and how they’re doing on average. As we enter data, the chart is conditionally formatted to change colors based on whether our students are achieving their goals (90% or better accuracy) which results in a green cell, close to the target (80-89% accuracy) which results in a yellow cell, or below target (<79% accuracy) which results in a red cell and means that our students need additional support in this specific area.
To see this process in action, check out the video below! Then, be sure to grab our free Data Tracking System. This tool will help make data tracking easy and help you keep your session data organized.